If Health Systems Could Talk:

Illuminating the Vital Signs of Strong Primary Health Care

Executive Summary

Every day, leaders face tough choices to ensure that their health systems can protect everyone, in crisis and calm.

Imagine making those decisions in the dark, with sparse information on where primary health care – the foundation of health systems – is working or not, and why.

While global commitments to primary health care extend back decades, as recently as 2015, there was no comprehensive framework for primary health care, and once the essential building blocks were defined, only 25% could be evaluated through well-established measures.

The good news: we have come a long way.

After helping to define what strong primary health care should look like, the Primary Health Care Performance Initiative has partnered with 23 countries to date to develop a Vital Signs Profile: an actionable snapshot showing the strengths and weaknesses of primary health care in the health system.

At a pivotal moment for health systems everywhere, this report takes stock of what we have learned from the Vital Signs of primary health care in 23 countries:

It is possible to define and examine the strength of primary health care in a rigorous, standardized way and therefore necessary to prioritize a primary health care approach in any national or global health data collection effort. This includes elements of health system Capacity that traditionally seemed difficult to measure, such as governance, team-based care, or community engagement.

Data from the Vital Signs Profiles confirm, with stark clarity, that every country’s path to strong primary health care should be highly tailored to maximize resources and impact. While countries are aiming for the same destination, they are starting with widely varying strengths and weaknesses. Better measurement can pinpoint where action is needed most in each country, thereby helping leaders set strategic priorities, leverage existing resources efficiently and effectively, and accelerate progress toward Health for All.

We need more and better PHC data on a global and sub-national scale, so that leaders everywhere can hear what their health systems are saying about the state of primary health care. In particular, quality remains the most undermeasured aspect of primary health care Performance; and more nuanced data on Equity and Financing can give leaders the information they need to govern health systems that respond to everyone’s needs, without causing financial hardship. By reimagining how PHC data is collected, harmonized and used going forward, we can ensure that better measurement translates into concrete action and accountability.

Strong primary health care is the foundation of health systems that can help manage today’s COVID-19 crisis, build resilience to future threats, and achieve universal health coverage. With more and better measurement, it’s possible. The time to act is now.

Introduction

Investments in primary health care can’t wait

The story of any health crisis often begins with a common dilemma: someone, somewhere, starts to feel sick. In certain stories, the source is an infection or heart attack; in others, it’s the first symptoms of cancer or depression. In December 2019, it was COVID-19.

While we can’t predict every health challenge that will arise, people’s concerns in these moments often revolve around familiar questions:

Should I seek help? Is there a health facility nearby? How much time, money, or effort will it take? Can I trust the staff and services? Will they help me get better?

Strong primary health care is the foundation of strong health systems—ensuring all people can get the right care, at the right time, right in their community.

The ongoing COVID-19 pandemic is a stark example of what happens when this foundation is not strong enough. It should also be a wake-up call for leaders everywhere to invest in primary health care as a priority—now.

With more and better data, progress is possible

The good news is that today, we know more about what strong primary health care should look like, and how it can be measured, than ever before. This was not always the case: as recently as 2015, there was no comprehensive framework for the essential building blocks of primary health care across countries. Once these building blocks were defined, only 25% of them could be evaluated through well-established measures.

This meant that the leaders who were responsible for governing health systems rarely had a full or accurate picture of where their system was strong and weak, and more importantly, why.

The Primary Health Care Performance Initiative (PHCPI) is a partnership that has been working to fill these gaps and translate data into information that leaders can act on. To date, PHCPI has worked with 23 countries to develop and release a Vital Signs Profile, a first-of-its-kind tool that helps stakeholders quickly diagnose the main strengths and weaknesses of primary health care in their country.

As leaders everywhere face tough choices to ensure that health systems protect everyone in the pandemic and beyond, this report aims to share what the first generation of Vital Signs Profiles can tell us about measuring and strengthening primary health care.

Ultimately, as people everywhere demand strong health systems that are long overdue, leaders must start at the foundation: primary health care. These investments are just as vital to today’s pandemic response as they will be to ensuring a swift recovery, building resilience to future threats, and achieving our shared goal of universal health coverage.

'Primary' for a reason

Strong primary health care can meet the vast majority of people’s diverse health needs across a lifetime. Primary health care is a health system approach that should reach and support every community by:

  • promoting healthy behaviors and routine check-ups
  • preventing disease and injuries
  • providing and coordinating any curative, rehabilitative, and palliative care that people need.

Health workers in primary health care settings are more likely to know the unique needs and context of the community, and can build long-term relationships with people they serve. This keeps people healthy in times of calm, saves lives in times of crisis, and increases collective trust and participation in the health system overall.

In the face of a crisis like COVID-19, strong primary health care becomes the frontlines of epidemic response, including by:

  • ensuring people get tested and vaccinated
  • supporting contact tracing and information sharing
  • helping people manage short- and long-term symptoms.

Strong primary health care also makes the health system more resilient. Even in an emergency, people need other essential health services—including for maternal or newborn health, sexual and reproductive health, non-communicable diseases and more—to continue without disruption.

Measuring the Vital Signs of PHC

Strong primary health care is measurable – and therefore achievable.

One of the most important lessons from the first 23 Vital Signs Profiles is that it is possible to define and examine the strength of primary health care in a rigorous, standardized way. This is something that could not be said with confidence at the start of the Sustainable Development Goal era, and should help dispel any myths that primary health care is too difficult for leaders to define, measure, or prioritize.

That said, primary health care remains a complex, multi-faceted concept that could never be summarized with a single number. By pulling data together from diverse sources and distilling this information in an accessible way, the Vital Signs Profile helps leaders visualize and act on the main strengths and weaknesses of primary health care in their health system.

The first generation Vital Signs Profile measures across four main pillars: Financing, Capacity, Performance, and Equity.

Crucially, each Vital Signs Profile acts like a unique fingerprint. Across all countries that finalized a first-generation Vital Signs Profile between 2018 and September 2021, no two have seen the same story revealed across the four pillarsMoreover, countries need to increase investments in each of these areas—and pay attention to how different domains influence one another—to realize the full promise and potential of primary health care.

Eleven countries launched the first Vital Signs Profiles in 2018 at the Global Conference on Primary Health Care in Kazakhstan.

hover and click
to learn more
The Anatomy of a Vital Signs Profile (VSP) *Sample First-Generation VSP *Sample first-generation Vital Signs Profile has four key domains, all shaped be deep collaboration with Trailblazer country stakeholders. Hover over a pillar for more infomation.
financing
PHC spending
35%
$29 per capita
sources of spending
14%
government
86%
other
How much does your government spend on primary health care?The Financing pillar of the VSP provides standardized metrics for how much money is spent per person on primary health care in a country and as a proportion of total health spending, based on a shared definition developed by the World Health Organization.
capacity
governance
inputs
Population Health and Facility Management
Does your system have the policies, infrastructure, and other physical and human resources required to deliver primary health care?Are the fundamentals of primary health care service delivery -- such as strong population health management and effective facility management -- in place? To effectively measure Capacity, PHCPI pioneered a new measurement tool called the PHC Progression Model that combines quantitative and qualitative data from a diversity of informants, documents, and data sources.
performance
access
quality
service coverage
Does primary health care in your country deliver quality care that meets people's health needs?The Performance pillar looks at how a country is doing in terms of access, quality, and coverage of care and services. To gain the clearest picture of performance in their Vital Signs Profiles, stakeholders supplemented globally comparable data with data from local sources.
equity
access by wealth quintile
coverage of rmnch
outcomes: u5 mortality
Does primary health care effectively serve the marginalized and disadvantaged groups in your society?Building on growing evidence that high-quality primary health care reduces health inequities, the Vital Signs Profile examines whether all people are receiving the care they need -- regardless of where they live, how much money they have, or how much education they have received.
×
Methodological Note

Lessons from the Pillars

The greatest value-add of the Vital Signs Profile is its ability to help national stakeholders visualize their entire system and take action across all pillars of primary health care. Nevertheless, a handful of important lessons emerged across countries that completed a Vital Signs Profile in the process of developing and measuring each unique pillar. Click on each pillar to read more:

There is no global target for spending on primary health care (PHC). However, we know that infrastructure, providers, and other critical resources for PHC remain underfunded in countries around the world.

To better understand investment in PHC, the Vital Signs Profiles measurement tool draws on recent work by the WHO to track PHC expenditures using a globally standardized measure and approach. This is an important step toward understanding how to fund primary health care more effectively and efficiently.

VSP country data confirm that, on average, governments in upper middle-income countries spend more per capita on PHC than lower-income countries, although there is wide variation among countries at similar income levels. Given that primary health care investments play a critical role in advancing equity and access to health services, and thus also advancing universal health coverage and greater health security, boosting funding levels to strengthen PHC is essential.

A deeper analysis of VSP data reveals that less than half of PHC spending comes from government sources in low- and-middle income VSP countries alike, illustrating an opportunity for governments to continue mobilizing domestic resources for PHC overall, ideally from pooled, public sources. Extrapolating from what we know about overall health spending globally, it’s likely that out-of-pocket spending comprises a substantial portion of the other sources of funding for primary health care.

High out-of-pocket costs, especially at the point of delivery, can be catastrophic to individuals and families, particularly in the most marginalized communities. Even modest costs can deter people from seeking the care they need, which can put their health—and as we have seen during COVID-19, potentially the health of others—at risk. Placing the burden of PHC costs on people and communities is an inequitable way to fund primary health care, which holds such promise to promote health equity when strong and effective.

This is why efforts to strengthen PHC financing cannot focus solely on increasing overall spending within a country, which risks further marginalizing vulnerable populations if they are left to foot the bill through co-payments and other out-of-pocket costs. However, to identify and address potential inequities, leaders need more and better information on PHC-specific financing to have a clearer picture of where funds are coming from.

Per capita PHC spending broken down by funding source

Methodological Note

Since Vital Signs Profiles were completed across multiple years, the financing data in this graph were standardized to the 2018 data year of the World Health Organization Global Health Expenditure Database. As such, the financing statistics used in this report may not match the figures published in countries' original VSPs, and only includes those VSPs that utilize SHA 2011.

In addition to needing more and better data on who is bearing the costs of primary health care, countries need more granular health expenditure data on where and to what PHC funds are being channeled, and whether these investments are producing the desired results. Without this, countries cannot know which investments – for example, increasing nursing staff and doctors or financing technological advancements – have a greater impact on PHC Capacity, Performance and Equity. Countries may also look to decrease inefficiencies caused by duplication due to multiple funding flows and pools as well as within the purchasing process, i.e. how PHC funds are being spent and how service providers are paid, for example. Though strides have been made to shape a global measure of PHC spending for potential cross-country comparison, more work is needed on country level measures with sufficient context to drive local policy decisions.

Issues of PHC financing have only become more complex with the pandemic, as outlined in a recent World Bank report on financing of health in the time of COVID-19. In the face of COVID-19, government spending surged to deal with the health and economic impacts, leading to increased government debt. As a result, government expenditures are now expected to decline in the near term. While the level of future government spending on health is uncertain, out-of-pocket spending is projected to decrease—but mainly as a result of missed or deferred essential and routine care, rather than from increased portions of governmental or external financing on health care costs. In past crises, reduced funding for PHC critically impacted services and shifted costs back onto people. During crises like these, and especially in the lowest-income settings, countries benefit from donor funding committed to supplementing domestic resources for comprehensive primary health care.

Overall, protecting and increasing investments in primary health care and community health – especially in vulnerable communities – will be critical to maintaining health system performance during this crisis and meeting the need for gains in quality and access already identified before the pandemic.

To achieve universal health coverage and ensure no one is left behind, maximizing public spending for PHC is an important first step. In tandem, we must work to increase the availability and quality of PHC financing data. In the hands of civil society and decision-makers alike, more and better data will increase countries’ ability to deliver strong PHC for their communities.

The “capacity” of a Primary Health Care system refers to the foundational properties of the system that enable it to deliver high quality primary health care (PHC).

Many different structural elements are needed to achieve a high-functioning health system.

In addition to the more visible capacities associated with quality care at the point of service — such as an adequate number of trained care providers and sufficient medicines and supplies — there are additional elements at play behind the scenes.

These include activities led by countries like planning, procurement, staff management and community engagement, as well as less tangible elements such as leadership and trust. Because each and every one of these components of PHC impact if and how people seek care, it’s critical to comprehensively assess them and gain a full picture of health system capacity.

The good news is a novel tool used for the VSPs called the PHC Progression Model demonstrates that this level of robust data collection on Capacity is possible. The PHC Progression Model represents the first comprehensive and standardized mixed-methods measurement of PHC system Capacity. This tool defines key components of PHC system Capacity and leverages both quantitative and qualitative data sources across three domains: Governance, Inputs, and Population Health and Facility Management.


A Novel approach to how
PHC Capacity is measured

The PHC Progression Model represents the first comprehensive and standardized mixed-methods measurement of PHC system Capacity. It looks at 33 measures, each of which is scored from a Level 1 (low) to Level 4 (high). To ensure sufficient data, the Progression Model process helped countries identify, gather, and synthesize information from a large range of datasets, documents, and key informants. Each country’s Progression Model leverages a unique combination of data sources, with interviews spanning across government, civil society, academia, development partners, private sector and more.

The graph in this section depicts the Capacity data collected across VSP countries that completed a Progression Model.

Though each country has a unique PHC Capacity profile, seeing these data together highlights some patterns worth exploring. Historically, certain capacities have been less understood and have received less investment. These include elements that relate to how a health system is delivering for and working with individuals and communities, such as: social accountability, community engagement and community health workers.

Many VSP countries were found to have lower levels of these capacities, suggesting they may be key areas of focus for PHC improvement. For example, the majority of VSP countries have systems for surveillance to track disease metrics. But few have reached an adequate capability for less visible capacities such as local priority setting and leadership that enable data to be transformed into improved population health. Several countries had reached a higher level on their capacity to pay health workers, but lacked systems for equitably distributing that PHC workforce to ensure care is delivered at the right place and time.

PHC Capacity Levels Across Countries

Methodological Note

Depending on when they completed their Progression Models, countries assessed their PHC capacity using one of two versions of the Progression Model. To allow for comparability in this report, PHCPI underwent a review process to harmonize the measures used in the two versions. All measures except one were determined to be similar across the two versions. There was no equivalent measure for "Primary Health Care workforce competencies" in the earlier version, so this measure was excluded from the analysis. To learn more about any of the specific indicators featured in the Capacity graphs, including their definitions and measures, explore the detailed PHC Progression Model rubric.

Importantly, the unique mix of data in the Progression Model and the collaborative process of uncovering the data with country stakeholders revealed vital insights to inform country action on weaker areas of PHC Capacity.

The specific goals outlined in the rubric of the Progression Model can also act as a blueprint of best practices for PHC Capacity that countries can strive to implement, learning from each other along the way.

PHC Leadership (Level 3)

While Morocco’s data revealed strong national PHC leadership and accountability, qualitative feedback from sub-national directorates revealed a more complex story. The VSP identified some gaps in coordination mechanisms between national, regional and local entities. In particular, local leaders, especially in some remote areas, faced staffing or budgetary challenges affecting their ability to effectively channel available resources to PHC. With this realization, the government is now taking steps to bridge and improve PHC leadership at all levels throughout the country, including ensuring that all levels of the government are engaged in setting PHC improvement priorities (i.e., local priority setting). The Ministry is already planning work with regional counterparts to develop and implement relevant and operational action plans—including a dashboard to monitor the PHC performance—building on the forthcoming publication of the PHC National Strategy in late fall 2021.

Health Workforce (Level 2)

In Colombia, the government knew that health workforce availability and quality were areas for growth before starting the VSP. The Progression Model helped articulate specific opportunities to improve collaboration across central and regional government sectors and non-governmental institutions to support the PHC workforce (i.e. multi-sectoral action). For instance, although there are mechanisms and regulations in place to support coordination between the Ministries of Health and Education, educational institutions have a high degree of autonomy when deciding which programs to open and how many students to accept—and it is important to ensure these decisions support national priorities and targets for strengthening the training and quality of the health workforce. The assessment also identified a need to improve mechanisms for distributing health workers equitably across rural and urban areas (i.e. workforce density and distribution), and encouraged Ministries of Health, Education and Labor to increase coordination so that PHC workers are guaranteed appropriate compensation, social protection and incentives no matter where they live and work. Lastly, the assessment highlighted that organizing multidisciplinary healthcare teams would be an impactful way to provide PHC services more efficiently and better meet the needs of local communities.

Community Engagement (Level 1)

At the time Mozambique completed its Progression Model, the Ministry of Health had already begun developing a Community Health Subsystem Strategy, to leverage community health engagement. Stakeholders were not surprised that the system was performing at Level 1 of 4 in community engagement at the national level. However, through key informant interviews and sub-national analysis, the assessment team identified some positive examples of strong community engagement in specific regions of Mozambique and approaches that could serve as models for the rest of the country. These insights are now being used to inform plans to increase the involvement of community members in the new strategy. The Ministry of Health plans to promote the use of Community Score Cards and Health Management Committees, and formalize systems for incorporating regional and local input into decision-making within the strategy.


To transform primary health care, countries must clearly understand if and how well all communities are being served by the system in place. The Performance pillar of the VSP gets at the heart of this issue by assessing how well primary health care (PHC) is performing in terms of three mutually-reinforcing domains: Access, Quality, and Service Coverage.

Looking at the combined Performance data within and across VSP countries, it is clear that substantial room for improvement remains across all three domains.

  • Access is quite variable across VSP countries, and nearly a third of people in VSP countries report substantial barriers to care. More often than not, the Vital Signs Profiles found greater perceived barriers due to financial cost, than to geography.
  • While Quality values are also quite variable across VSP countries, nearly all show major deficits. In the many areas where quality data is lacking, performance on Quality is likely even worse than the available data show, as suggested by a growing body of research on high-quality health systems. Indeed, the three VSP countries with the highest Quality indices had more than half of their indicators missing. Underlying challenges in quality can only be seen and addressed with intentional investments in PHC quality data.
  • For Service Coverage, where there is greatest data availability, barely over half of all people across VSP countries received necessary or recommended services – and the best performing country barely topped 70% coverage. However, even where a comprehensive range of services is available, leaders need to ensure the services are effective and high-quality – which is why all elements of Performance must be taken into account.

Three domains of PHC performance:

Access: People’s ability to get the primary health care they need when they need it, regardless of where they live or how much money they have.

Quality: PHC services that meet necessary standards for comprehensiveness of care, continuity of care, person-centeredness, provider availability and competence, and safety practices.

Service Coverage: The proportion of the population that is receiving the range of essential services they need, including for infectious diseases, maternal and child health, and non-communicable diseases. These interventions are selected from the UHC Service Coverage index, and the vast majority can be delivered through strong primary health care.

Taken together, these domains reveal how much work remains to improve primary health care performance. Greater investment in all areas of Performance—which also depends on strong neighboring pillars of Financing, Capacity, and Equity as wellwill be necessary to build systems that meet people’s health needs.

From a measurement perspective, the Performance pillar—and Quality in particular—also highlights that missing data continues to pose a major obstacle to ensuring strong, equitable primary health care.

To complete this pillar of the VSP, PHCPI recommended a core set of Performance indicators drawn from global service delivery datasets. Additionally, most VSP countries also supplemented their assessment with data drawn from in-country sources, illustrating that performance can be assessed effectively through a mix of global and local data sources.

As shown, data in each Performance domain was often missing despite these innovative efforts to source information from both local and global sources. And while countries generally had more data available for Service Coverage and Access, only 45% of Quality indicators in the VSP had data available. These gaps meant that some important measures of PHC Quality—such as timeliness, provider motivation and coordination of care—could not be included in the VSP at all.

Even for PHC Service Coverage—which has the greatest data availability from the global UHC Coverage Index—the data picture could be strengthened going forward. For example, we know that countries are more likely to have data available on infectious diseases and maternal and child health, and less likely to have data on tracer interventions for non-communicable diseases, even though combined, NCDs represent the leading cause of premature death and disability around the world. This means that many countries may be missing critical insights into how primary health care is managing and responding to these health needs. Moreover, leaders need to ask not only what services are being delivered, but how they are being delivered – so that countries can move from fragmentation to person-centered integration.

Looking ahead, it is imperative that countries continue to improve data collection processes to meet people’s health needs and strengthen PHC performance. With more and better PHC data, countries can pinpoint where they need to improve most and drive resources to overlooked areas, such as quality, that may accelerate PHC progress.

Performance Across Three Domains, by Country

Methodological Note

The Performance domain looks at three key dimensions of service delivery:

  • Access includes measurements of perceived financial and geographic barriers to care using data from USAID’s Demographic and Health Surveys (DHS).
  • Quality of care measures include indicators of comprehensiveness of care, continuity of care, person-centeredness, provider availability and competence, and safety practices.
  • Coverage measures the proportion of the population in need of services who receive them. These services include a broad range of PHC-focused clinical services, based on the UHC service coverage index of essential health services from the joint WHO/World Bank Group report in December 2017.
Headline scores for Access, Quality, and Coverage are calculated by taking the unweighted average of indicator values within subdomains, and then taking the average across subdomain scores. In the case of select indicators where the desired value would be small in high-performing systems, specific variables are transformed by subtracting the value from 100 before inclusion for calculation of summary scores.

In cases in which a global source was not available, an attempt was made to identify a similar indicator using locally-available data relevant to the specific domain.

Data Gaps in the Quality, Service Coverage & Access Indexes

Methodological Note

To allow for completeness of data, some countries used alternative sources of locally available and contextually appropriate data for indicators. The PHCPI report team reviewed all such indicators to ensure that similar concepts were being measured and excluded indicators in cases in which alternative data sources did not provide a comparable measure.

We can’t say a health system is functioning well if it’s not functioning well for all people, especially a country’s most vulnerable communities.

The VSPs leverage data related to three common sources of health disparities – wealth, level of education and the rural and urban divide – to assess three critical dimensions of equity: access, coverage and outcomes. To demonstrate equitable service delivery grounded in primary health care (PHC), a country must perform well on all three dimensions.

Data from the VSPs showed that every country, regardless of its income or levels of PHC Performance or Capacity, had significant room for improvement on at least one dimension of Equity. This reveals that countries cannot rely on any single measure of equity alone to understand whether communities are being underserved and that there is no common formula or path to achieve equity.

While the Equity pillar helps provide a first “diagnosis” of inequities, the root causes from country-to-country are difficult to determine without additional information. For example, countries with more government PHC spending also tended to have lower disparities in perceived access barriers due to cost. Pairing equity data with other aspects of PHC enables countries to explore potential relationships and sources of inequity as well as the best ways to address them.

Every country’s journey to equitable health care will look different. More and better data will help them craft blueprints of health systems that have a strong foundation in PHC and the best chance to provide all people with the care they need and deserve. 

PHC Equity Values by Country

PHC Equity Values by Indicator

PHC Equity Values by Indicator

Methodological Note

The Equity pillar is made up of three key indicators. The indicator for "equity in access" uses data from Demographic & Health Surveys (DHS) from the DHS STAT compiler to calculate differences in perceived financial barriers to care between the highest and lowest quintiles of wealth for the country. The "equity in coverage" indicator uses data from the WHO Health Equity Monitor to assess the difference in effective coverage of maternal and child health care services between mothers with secondary education compared to those with no education. The "equity in outcomes" indicator also uses data from the WHO Health Equity Monitor to indicate the difference in under-five mortality of children residing in urban and rural areas of the VSP country. Countries included in the figures are those with complete equity data.

Access

% with perceived barriers due to cost, by wealth quintile (lowest ● vs. highest ✚)

Coverage

% of RMNCH services covered, by mother's education (no education ● vs. secondary education ✚)

Outcomes

Under-five mortality rate, by residence (rural ● vs. urban ✚)

Vital Signs in Action

No two countries will have the same path to strong primary health care.

EVERY COUNTRY HAS A UNIQUE PHC “FINGERPRINT”

While there is now growing global consensus around what ‘strong primary health care’ should look like, the Vital Signs Profiles have confirmed, with stark clarity, that no two country strategies for getting there will look exactly alike.

A snapshot of data from all 23 Vital Signs Profiles concretely reveals that every country is starting in a very different place. Each country has strengths and weaknesses in primary health care, and these vary widely, even within country income groups.

It follows that each country must tailor its strategy to make the most of limited resources, and ultimately find the most efficient and effective path to strong, equitable primary health care.

The COVID-19 pandemic has sent a clear signal that primary health care is not strong enough around the world. However, the specific details of each country’s unique primary health care “fingerprint”—shaped by generations of both local context and global influences—are only visible with more and better data.

countries' unique strengths and gaps

*Value 1 (outer ring) = High 

Methodological Note

countries' unique strengths and gaps

*Value 1 = High 

Methodological Note

VITAL SIGNS IN ACTION: LESSONS FROM COUNTRIES

With a Vital Signs Profile in hand, leaders can see where their system is working or not, and more importantly, why.

This information opens countless doors by helping leaders to:

  • Make informed decisions about where to spend time and resources
  • Track progress and communicating these updates to constituents or funders
  • Gain new insights into long-standing trends or surprising gaps  

Take a look at how Ghana, Malaysia, and Mozambique are using their Vital Signs to spur health system improvements.

Click on a country to learn more.

Creating an Evidence-Based Action Plan for Strong Primary Health Care

Ghana was among the first 11 countries to create a Vital Signs Profile and present it at the Global Conference on Primary Health Care in Kazakhstan in 2018. Just as meaningful as the results were the participatory processes that led up to and followed this moment -- ultimately culminating in an evidence-based national Strategic Implementation Plan for PHC.

From the beginning of the Vital Signs Profile process, leaders at the Ghana Health Service emphasized the importance of Ghanaian stakeholders taking ownership at all levels, so that results could be institutionalized and woven into existing structures wherever possible. In order to make this happen, they convened a multi-stakeholder technical working group that drove the process of populating Ghana’s Vital Signs Profile to resonate in a local context, while PHCPI partners provided technical guidance and facilitation support.

Once completed, Ghana’s Vital Signs Profile reflected several key strengths of the health system, drawing on decades of investment in primary health care. For example, Ghana stood out for having a clear cadre of health workers who were adequately trained, salaried, and distributed across the population, and whose primary responsibilities were primary health care-related – just one important legacy of Ghana’s trailblazing Community-based Health Planning and Services (CHPS) program, established in the 1990s.

The Vital Signs Profile also demonstrated several key areas for improvement, including ensuring clear management structures at the facility level and tracking the supply of essential medicines and equipment.

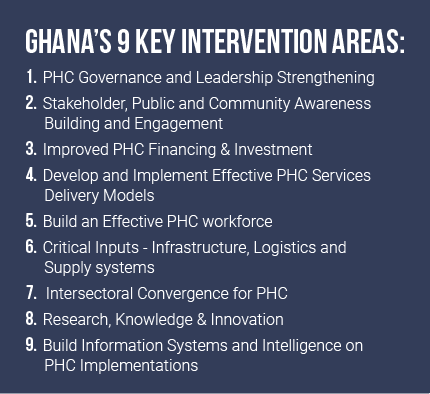
These Vital Signs Profile results were put to work right away. With support from a Trailblazer Opportunity Fund grant from PHCPI, Ghana’s Vital Signs were distributed widely to stakeholders at national, regional, district, and health facility levels. This helped set the scene for regional workshops with 70+ Senior Managers to define priorities for a national Strategic Implementation Plan for primary health care. According to key stakeholders, the process of completing and disseminating the Vital Signs Profile played an important role in sensitizing key decision-makers to the ‘health’ of primary health care in Ghana; building consensus on key strategies to fix gaps; and informing the nine top priorities for the Strategic Implementation Plan (see box)  – each coupled with short, medium, and long-term actions.

At the end of the day, countless stakeholders later commented that the participatory process for producing and leveraging the Vital Signs Profile was as valuable as the results, generating significant stakeholder engagement and buy-in that enabled a rigorous understanding and snapshot of primary health care in Ghana to be embraced and translated to action.

Aligning Public & Private Health Care Systems to Meet People’s Needs

After completing a partial Vital Signs Profile in 2018, the Malaysian Ministry of Health decided to collect data on Capacity measures by completing a PHC Progression Model in 2020. They wished to continue improving comprehensive measurement of primary health care in Malaysia, including for quality of care; and to increase Malaysia’s ability to benchmark and showcase its progress on a global scale.

The Ministry of Health also brought specific questions to the table – namely, how to better understand and integrate the country’s public and private health care systems.

Like many countries, Malaysia offers primary health care services through both public and private providers, with around 3,000+ public facilities and 6,000+ private facilities. Even though there are more private facilities across the country, the public sector accounts for approximately 64% of primary health care utilization in the country. The public sector is heavily subsidized by the government, whereas the private sector charges user fees for patients.

The Progression Model highlighted that information systems are one particular strength of Malaysia’s public health sector, from successfully recording 90-99% of all births and deaths in the country to maintaining long-term personal care records in 91% of public health clinics. Malaysia also regularly collects health status updates from all public primary health care facilities. Beyond informing direct patient care and administration in communities, this facility data feeds into a centralized Malaysian Health Data Warehouse that supports strong governance and informed planning at the national level.

By comparison, Malaysia’s private sector facilities were not as integrated into the country’s information systems. If harnessed to support the private sector as well, these systems could help boost quality and responsiveness across all facilities.

The Ministry of Health was committed to including a close look at the private sector in its Vital Signs Profile assessment. The Progression Model enabled the MOH to unearth specific, actionable information, including:

  • Exactly where and how many private facilities did not have data integrated into existing information systems
  • Which facilities have regulatory approval to deliver essential drugs or required, well-functioning equipment.

Now, the government is exploring ways to address remaining data gaps and strengthen coordination with the public and private sectors, building on the recent launch of a web-based platform to facilitate data collection from private practitioners. The country will review current legislative instruments like the Private Healthcare Facilities & Services Act and assess the potential for expanded use of electronic medical records, surveys, and audits to further institutionalize data collection from the private sector.

The upcoming National Policy for Quality in Healthcare, expected to launch in October 2021, will also reflect additional pathways to strengthen engagement between both sectors to strengthen primary health care delivery.

Strengthening Local and National Information Systems during COVID-19

In the last year, Mozambique completed its Vital Signs Profile amid the COVID-19 pandemic. The Ministry of Health quickly leveraged assessment results to develop the country’s 2020-2024 Strategic Plan for the Health Sector. While the previous strategic plan for 2014-2019 was grounded in the guiding principles of primary health care, it lagged in the use of evidence and data to inform and implement concrete policies and plans to strengthen the health system. The Vital Signs Profile data, including the Progression Model, helped bring areas for improvement into sharp focus and shape an array of primary health care initiatives—from crafting new health sector policies to formulating investment plans for the Global Fund and Global Financing Facility.

Mozambique was able to draw on a uniquely rich set of data to complete its Vital Signs Profile, particularly at the sub-national level, due to efforts to develop resources like Community Score Cards and Performance Balance Reports that are used in 75% of districts and 75% of health facilities. This helped government stakeholders to clearly identify and track goals across national, provincial, and district levels. Critically, the Vital Signs Profile identified that at all levels nationwide more investment is needed in the fundamental building blocks of primary health care – elements such as the availability of essential medicines, basic equipment, and the health workforce.

Data also revealed key differences between levels of the health system in resources for and implementation of primary health care. Identifying these gaps has been instrumental as Mozambique continues work to decentralize administrative and financial governance of the health system. The country was able to act quickly to address one key gap in the use of informational systems to respond to the COVID-19 pandemic. Though Mozambique has an electronic monitoring and evaluation system, the Progression Model revealed it was not being fully implemented in lower, community-level facilities. Limited analytical capacity and a reliance on paper records in most health centers contributed to poor data quality, undermining the ability of the system to support effective decision-making.

This insight influenced Mozambique’s decision to roll-out a novel surveillance system at community-level facilities to capture flu-like symptoms as part of the national COVID-19 response. Local focal points were appointed to capture and transcribe COVID-19 indicators into the national database, providing more timely and complete information to support the Ministry of Health in COVID-19 response planning and resource allocation.

23 countries & counting

To date, 23 countries have partnered with PHCPI to complete their Vital Signs Profile, each revealing a unique story. More Vital Signs Profiles are on the way. Select any country on the map to learn more.

■ in progress     ■ finalized

Methodological Note

Scaling Up Progress

We need more and better data at global and sub-national levels to accelerate progress on primary health care.

While a major step forward, these 23 Vital Signs Profiles are just the beginning. To accelerate progress on primary health care and make every investment count, now is the time to make sure that all countries have a clear understanding of their unique primary health care “fingerprint,” as well as how to translate that information into action.

Building on lessons from the first generation of Vital Signs Profiles, there is still a vast amount of work needed to fill primary health care data gaps, refine and scale measurement tools.

For example, across the Vital Signs Profile pillars, quality remains the most undermeasured aspect of primary health care Performance, and therefore should be on every leader’s radar to prioritize. More nuanced data on PHC Financing and Equity is also necessary to ensure that health systems are responding to everyone’s needs, without causing financial hardship.

As health systems are strained to a breaking point—from COVID-19, to the climate crisis, to rising inequities within and across countries—we need to radically scale up the quality and quantity of PHC data available to decision-makers and ordinary citizens.

This means taking a hard look not only at what information countries are collecting, but how they are collecting and making sense of it, and who is most likely to use and benefit from it. These key shifts needed in PHC measurement go hand-in-hand with every pillar of strong primary health care.

Key Shifts Needed in PHC Measurement

FINANCING

Leaders can work to ensure that countries’ main mechanisms for standardizing, collecting, analyzing and reporting PHC data, particularly for PHC Financing, are fit-for-purpose in an evolving health systems landscape. At the moment, best efforts are being made with existing infrastructure, but many of these data systems were not designed for delineating and understanding PHC-specific expenditures. Investments are needed to align these data systems around a common definition of primary health care, and help leaders capture key local nuances—such as where primary health care funding is coming from, who is bearing the costs, and how funds are being allocated. This is the only way to make certain that primary health care is well-resourced and not causing financial hardship for those who need it most.

Capacity

Health system measurement should be led and driven by the people and communities whom it is intended to help. At its core, strong primary health care depends on strong community engagement—not least because this is the best way to ensure that the health system is responsive to people’s diverse needs. This goes for primary health care measurement as well. Local stakeholders need to be engaged in data decisions—including collection and analysis—to understand what strong primary health care should look like, know how their system is performing, and create a positive cycle of action and accountability. The process itself should be informed by a community’s unique needs, and leverage all available data resources—both qualitative and quantitative—to address more difficult-to-measure aspects such as governance, population health, and management.

Performance

Countries and donors should prioritize harmonizing data collection in global health—for example, across multiple household and facility surveys—and emphasize measurement of the primary care functions and a primary health care approach as organizing principles for service delivery. This will require additional development of new PHC-specific indicators and survey questions, but is one concrete way to move toward health systems that center people and their experiences, rather than single diseases or issue areas. Additionally, this will help make data collection more efficient and effective.

Equity

Equity must be front-and-center in all health system measurement efforts, especially for primary health care. Strong, primary health care is a crucial vehicle for reducing inequities of all kinds and finally ensuring health for all, including the marginalized and most vulnerable.  More and better data on who is benefitting most and least from the health system is the only way to know if the promise of primary health care – and ultimately universal health coverage – is being realized in practice.

Investing in improved PHC data and measurement systems is not a “nice-to-have,” but a necessity to ensure the quality, people-centered, integrated primary health care that people everywhere are demanding. If more leaders at national, sub-national, and global levels commit to more and better data for primary health care, they can help to accelerate crucial structural shifts in how primary health care is designed, financed, and delivered going forward, including the four fundamental shifts recently highlighted in a World Bank Flagship Report on Reimagining Primary Health Care after COVID-19.

To learn more about what it will take to reimagine primary health care in every country, check out a recent flagship report from a core PHCPI partner, the World Bank.

Looking Ahead

Recap: We have come a long way

The creation of the first generation of Vital Signs Profiles represented a significant step forward for primary health care measurement and learning experience all countries and stakeholders involved.

The PHC Vital Signs demonstrated it is possible to give health systems a voice—and by listening, leaders can accelerate progress toward strong primary health care. At last, we can say with confidence that defining and measuring progress against common primary health care goals is possible – including those that have been historically more challenging to measure, such as primary health care capacity, quality of care, or responsiveness to community needs. This is a crucial step toward more and better investment, more useful knowledge sharing within and across countries, and greater political accountability than ever before. Now that we know what the strong pillars of primary health care look like and how they can be measured—and have data from 23 countries to show it—it is necessary for countries to mainstream a primary health care approach across all efforts to strengthen health systems and collect health data going forward. This will help countries harmonize investments, improve how services are delivered, and achieve universal health coverage, ensuring people are centered every step of the way

No two countries will have the same primary health care strategy, and robust PHC data can help leaders tailor their approach to maximize impact. The Vital Signs Profiles demonstrate that each country is starting with a unique “fingerprint” of strengths and weaknesses across all domains of primary health care. While there may be certain domains of primary health care that require attention across many countries, the precise areas for improvement and their underlying causes vary significantly from country to country. Collecting robust PHC data helps ensure that leaders are not making critical decisions in the dark, especially when lives, livelihoods, and limited resources are at stake. When PHCPI was first launched in 2015, it was not possible to reveal those “fingerprints” as clearly as we can today – making us optimistic that even sharper findings may be just around the corner. Moreover, countries have shown that the process of developing each unique Vital Signs Profile is often just as valuable as the final result, engaging key stakeholders, ensuring data collection efforts are locally tailored and contextualized, and ultimately generating more political will to translate information into action.

Now, more and better PHC data is needed so that leaders in every country, including at the sub-national level, can hear what their health systems have to say about the state of primary health care. Illuminating the Vital Signs of 23 countries is not enough. We need to radically scale up the quality and quantity of PHC data available to decision-makers and ordinary citizens around the world—capturing the national and sub-national nuances that are critical to success. This also requires a fresh look at the ‘what,’ ‘how’, and ‘who’ of primary health care measurement, so that our data is truly fit-for-purpose to fuel our shared goal: a world where all people and communities can get the quality health services they need, without financial hardship.

A turning point for PHC measurement

In February 2022, the World Health Organization and UNICEF—two core PHCPI partners—jointly released the landmark global Primary Health Care Measurement Framework and Indicators, the official measurement framework in support of the Astana Declaration and corresponding PHC Operational Framework. This is the first-ever globally normative and endorsed primary health care measurement and monitoring framework and represents a pivotal opportunity to accelerate progress on a global scale.

All PHCPI partners are proud to have contributed to this new framework, informed by PHCPI’s early measurement work, robust partnerships with countries, and lessons from the Vital Signs Profile journey.

PHCPI partners are committed to help support and harness this new global push for more and better PHC data, which has the potential to inspire greater investment in primary health care, standardize, and streamline key aspects of PHC data collection efforts, and support leaders and advocates to create a much-needed cycle of action and accountability.

After decades of commitments, it is time for leaders to deliver on the promise of strong primary health care to help manage today’s COVID-19 crisis, build resilience to future threats, and finally achieve Health for All. With more and better measurement, it’s possible.

Four Decades of Advocacy

Header photo: ©Gates Archive/Saumya Khandelwal
Footer photo: ©Gates Archive/Daniel Lanari 

The Primary Health Care Performance Initiative (PHCPI) was a partnership dedicated to transforming the global state of primary health care, beginning with better measurement. When published, the content in this report represented the position of the partnership as a whole, though it did not necessarily reflect the official policy or position of any specific partner organization. With the conclusion of the partnership at the end of 2022, this report is hosted and managed by the World Bank and the content should not be considered to necessarily reflect the official policy or position of any former PHCPI partner organization. All responsibility for the interpretation of the content, and any action or inaction taken based on the information made available, lies with the user.

Report published October 2021. “Looking Ahead: A Turning Point for PHC Measurement” section revised in early 2022 to reflect the launch of the Primary Health Care Measurement Framework and Indicators. “Take Action” section revised in March 2023 to reflect new PHC Digital Hub and second-generation Vital Signs Profile (Beta) resources from the PHCPI partnership.